Draw Database Diagrams
It’s pleasant to admire drawings of database tables and their foreign-key relationships, which are
“data structure diagrams”
or more grandiosely
“entity relationship (ER) diagrams”.
I’ll show what the esthetic considerations are i.e. “does this look nice”,
and what the engineering considerations are i.e. “what do I have to do to make it at all”.
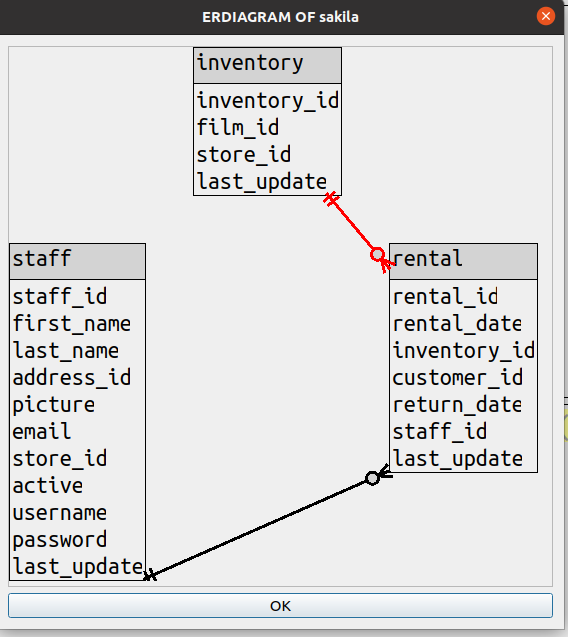
I’ll begin with the conclusion — here is a drawing of the well-known sakila database.
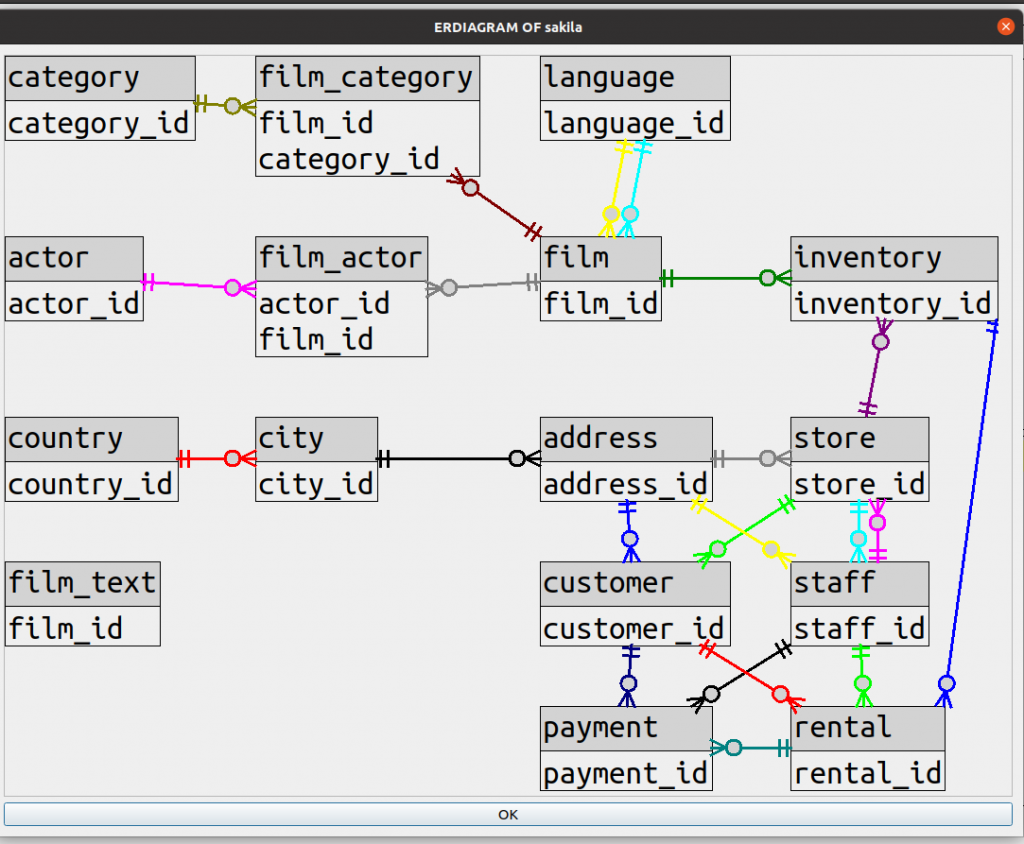
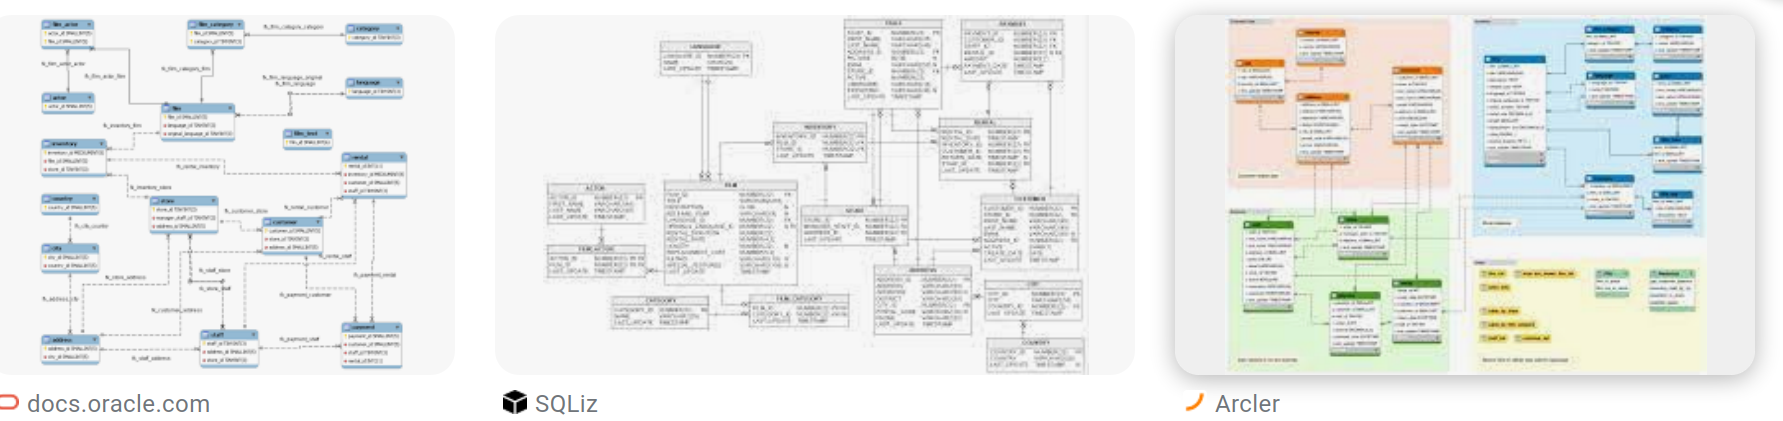
To find diagrams that other products draw for the same database, just google “sakila er diagram”.
You’ll see something like this:
and what I’m trying to address first is: who’s the fairest?
Esthetics
Esthetics, also spelled aesthetics, is “the formal study of the principles of art and beauty”. And there really have been formal studies where academics look for criteria that people judge are important. A fine description is in a Radboud University thesis by Bart van de Put, “Scoring Entity-Relationship Diagrams Drawn by a Computer Algorithm”. I will consider five criteria that the thesis mentions:
![]() Bends when a line makes a sharp direction change.
Bends when a line makes a sharp direction change.
![]() Crossings when two lines intersect or nearly intersect.
Crossings when two lines intersect or nearly intersect.
![]()
Edge non-orthogonality when lines are not all horizontal or vertical with right angles.
![]()
Node non-orthogonality when tables are not in a fixed rank-and-file grid.
![]() Inconsistent line lengths when some of a table’s relationships are short and others are long.
Inconsistent line lengths when some of a table’s relationships are short and others are long.
Although a computer program may not be great as a beauty contest judge, it can simply count bends and crossings, assign numeric weights to them, and come up with a negative score. Then picking for display a drawing with the best score can be achieved with brute-force comparisons or with functions that are slightly more sophisticated but enormously harder to write.
Bends
Unlike what happens in most of the google-result diagrams I mentioned above, I just declare “there are no bends”. All lines are straight, with many more angles than 90-degree up/down/left/right.
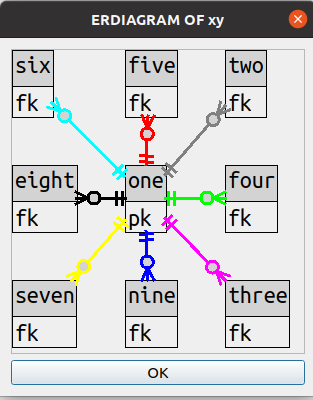
For example this is a table that had foreign-key relationships with 8 other tables.
Bend count: zero.
Let’s admit the downsides too:
(a) The original idea of structure diagrams was that lines could be done with as few as four ASCII characters
– | > <
and so were easy to reproduce. Drawing angles is perhaps technically possible with
ASCII art
but would need more screen space.
(b) In the situations where the classic style would bend around, the straight-line style will draw right through
a table. This can be illustrated with a sakila diagram that has all the columns, and the line between
rental and inventory goes right over the staff table.
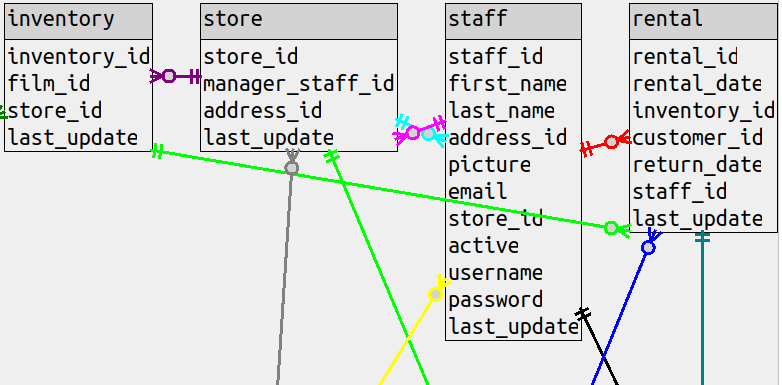
There’s an option to put the line in the background instead
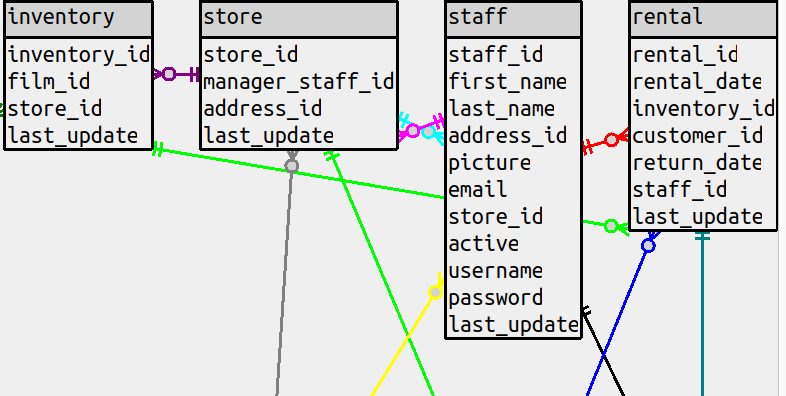
but either way, there’s an esthetic problem which should be weighted the same as a count of bends, or higher.
(c) we can’t put labels on any non-horizontal lines, so the only way to know the foreign-key constraint is to
hover over the line and wait for a tooltip to appear.
Crossings
Unlike the monochrome google-result diagrams I mentioned above, I just declare “different lines have different colours”. This has limited possibilities since the palette has to consist of only colours that are easily distinguishable and are not similar to the background colour, which would have a camouflage effect. So the practical limit is about a dozen colours. However, usually, when two lines are close or intersecting it’s easy to distinguish them.
Let’s admit the downside here too:
(a) this doesn’t reduce the number of crossings, it just patches over the problem
(b) it’s a matter of chance whether a bunch of colours is esthetic or not.
Edge non-orthogonality
The algorithm produces straight lines and almost no right angles so it is almost always edge non-orthogonal. As the Radboud University thesis says, edge non-orthogonality is considered a negative. But the thesis also admits that there are unnecessary bends otherwise. I’m giving bends more weight. I see in other products that edge orthogonality has more weight.
Node non-orthogonality
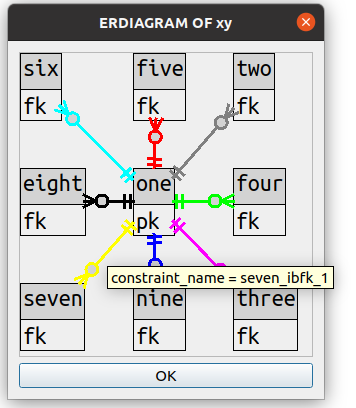
The algorithm places high weight on node orthogonality and one result is that tables are in fixed ranks and files, always. Again, this is unlike what I see in other products. I suppose that their criterion is compactness: if there are fewer spaces between tables, then there is less scrolling necessary to see the whole picture. So this is another case of a beautification with a downside, but I insist on it because of another consideration: specifiability.
Users will sometimes want to specify, instead of “ERDIAGRAM OF whole_schema”,
“ERDIAGRAM OF schema TABLES (table-list)”. Once we allow that much, it’s reasonably simple
to allow for users to say which tables should go in which fixed positions. For example,
consider this specification
SHOW ERDIAGRAM OF sakila TABLES (staff 0 1, inventory 1 0, rental 2 1)
which results in this
Users can figure out graphic coordinates such as 0 1 “position 0 on the X axis position 1 on the Y axis”.
They would be , however, if the coordinates had to be pixel positions instead.
Having straight ranks and files makes it possible to specify with small integers.
By the way, the automatic production of drawings based on databases is sometimes called “reverse engineering”. So I suppose the appropriate term for specifying a diagram like this is “forward engineering”, but the real engineering job is of course the CREATE TABLE statements.
Positioning
Suppose we have three tables A B C, and A references C, well then we wouldn’t want to draw B between A and C, we’d want the diagram to look like A C B. In other words, if we could just get related tables to be drawn close to each other with no intervening tables, we’d have no bends. For a tiny number of tables this is easy to see and to fix. But as the number of tables grows the possible number of possible table positions in the drawing grows geometrically, like a travelling salesman problem. So positioning is far more difficult than bend denialism or crossings anti-camouflage.
The Radboud University thesis mentions a tried-and-mathematically-solid way to get the fewest bends with a large number of related tables. I saw it too late, though, so the method I implemented might be inferior. Also I might have saved time by bringing in the Open Graph Drawing Algorithm library, but didn’t.
The method is like crystal formation.
Start by drawing the table A that has the most relationships, either referencing-from or referenced-to. Then, for each table that A is related to, draw nearby (as closely as possible without interfering with other tables) the related tables … starting with the table B which is related to A which has the most relationships, and so on until there are no more. This involves a lot of recursion.
The initial result of a crystal formation is sometimes pretty good, and then there are last-microsecond patchups that can enhance it. Look for pairs of tables that are not near each other and see whether, if they were exchanged with each other or if one of them was moved close to the other, the total bend count for the table would go down. This usually helps just a little bit and adds more than a little bit to the computer time, so it can only go on for a limited number of looks.
Touchup
So much for the esthetics that are specifically for ER diagrams. I suppose I should add that there have to be further esthetic features that apply to widgets in general. The diagram must be changeable with respect to fonts, header and detail background colours, and line widths.
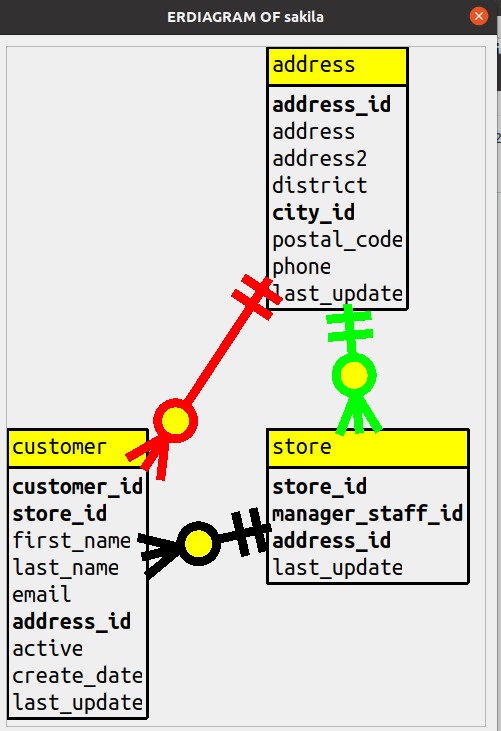
For example, for this diagram of a limited number of tables in sakila
I specified that column names ending with _id should be in bold, the lines should be extra wide,
and header background should be yellow.
(One thing users can’t change is the way that an arrow looks, the so-called Crow’s foot. At least one other product offers choices for this.)
I imagine that other high-class GUI clients can do such touchups so this is nothing special, but in a post about esthetics I figure I ought to mention this final step.
But where’s the SQL?
In this case the SQL statements are the easy part, especially if the DBMS supports SQL-standard INFORMATION_SCHEMA access.
All the necessary information about foreign-key relationships can be picked up with
SELECT … FROM INFORMATION_SCHEMA.KEY_COLUMN_USAGE WHERE …
There’s a quirk that is non-standard: your favourite DBMS insists that primary-key constraints must be
named PRIMARY, so KEY_COLUMN_USAGE has all we need for deciding which columns are part of the a primary key,
as well as which columns are part of a foreign key.
And if the user specifies that the drawing should have all columns instead of just primary-key columns,
SELECT … FROM INFORMATION_SCHEMA.COLUMNS WHERE …
does the job.
However, I don’t think it’s a good idea for the program to do those SELECTS every time the user asks for a drawing. They’re expensive on the server. (Rule: taking time on a client computer is trivial, taking time on the server might not be.) So this is done as part of an “explorer”, which means the user can slowly slowly pick up all the table and column and relationship information at once, so it’s stored in the local computer’s memory, and subsequent requests to draw don’t affect the server at all unless the user decides to refresh potentially-obsolete information.
ocelotgui
The feature I’ve just described comes with ocelotgui 1.9 which is available for download on github.