Make SHOW as good as SELECT even with InnoDB
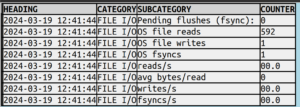
Here’s a snippet of what I’d like SHOW ENGINE INNODB STATUS to look like:
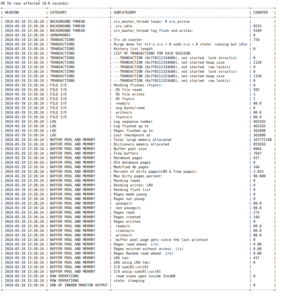
as opposed to what the server sends:
...
--------
FILE I/O
--------
Pending flushes (fsync): 0
295 OS file reads, 1 OS file writes, 1 OS fsyncs
0.00 reads/s, 0 avg bytes/read, 0.00 writes/s, 0.00 fsyncs/s
...
In my last post I described a way to
Make SHOW as good as SELECT”
which was possible because most result sets from SHOW etc. are at least table-like, but
STATUS’s wall of text isn’t table-like. So I forced it into a table with these basic rules:
- A line inside ——s, like FILE I/O, is the category of what follows.
- Otherwise a line is a row but if it contains commas it is multiple rows.
- Numbers can usually be extracted from text as different columns..
After that there’s still a bunch of fiddling, I put the details in source-code comments.
Version 2.3
The new features related to SHOW etc. are now in a released version as well as in source code,
downloadable from github.
In the rest of this post I’ll show a complete result from SHOW ENGINE INNODB STATUS; (“before”),
and the same data from SHOW ENGINE INNODB STATUS WHERE 1 > 0; after ocelot_statement_syntax_checker
has been set to ‘7’ (“after”). (Instead of copying the Grid Widget I copied from the History Widget
after setting Max Row Count to 100.)
“before”
| InnoDB |      |
=====================================
2024-03-19 12:39:45 0x7f80f01f3700 INNODB MONITOR OUTPUT
=====================================
Per second averages calculated from the last 43 seconds
-----------------
BACKGROUND THREAD
-----------------
srv_master_thread loops: 0 srv_active, 2455 srv_idle
srv_master_thread log flush and writes: 2454
----------
SEMAPHORES
----------
------------
TRANSACTIONS
------------
Trx id counter 754
Purge done for trx's n:o < 0 undo n:o < 0 state: running but idle
History list length 0
LIST OF TRANSACTIONS FOR EACH SESSION:
---TRANSACTION (0x7f8111334680), not started
0 lock struct(s), heap size 1128, 0 row lock(s)
---TRANSACTION (0x7f8111333b80), not started
0 lock struct(s), heap size 1128, 0 row lock(s)
--------
FILE I/O
--------
Pending flushes (fsync): 0
295 OS file reads, 1 OS file writes, 1 OS fsyncs
0.00 reads/s, 0 avg bytes/read, 0.00 writes/s, 0.00 fsyncs/s
---
LOG
---
Log sequence number 463193
Log flushed up to   463193
Pages flushed up to 362808
Last checkpoint at  362808
----------------------
BUFFER POOL AND MEMORY
----------------------
Total large memory allocated 167772160
Dictionary memory allocated 853016
Buffer pool size   8064
Free buffers       7647
Database pages     417
Old database pages 0
Modified db pages  164
Percent of dirty pages(LRU & free pages): 2.033
Max dirty pages percent: 90.000
Pending reads 0
Pending writes: LRU 0, flush list 0
Pages made young 0, not young 0
0.00 youngs/s, 0.00 non-youngs/s
Pages read 273, created 144, written 0
0.00 reads/s, 0.00 creates/s, 0.00 writes/s
No buffer pool page gets since the last printout
Pages read ahead 0.00/s, evicted without access 0.00/s, Random read ahead 0.00/s
LRU len: 417, unzip_LRU len: 0
I/O sum[0]:cur[0], unzip sum[0]:cur[0]
--------------
ROW OPERATIONS
--------------
0 read views open inside InnoDB
state: sleeping
----------------------------
END OF INNODB MONITOR OUTPUT
============================
 |
“after”
/

