The ocelotgui debugger
I have merged a debugger for MySQL/MariaDB stored procedures and functions into our GUI client and posted the source and binaries on github. It allows breakpoint, clear, continue, next, skip, step, tbreakpoint, and variable displays. Features which are rare or missing in other debuggers include:
its current platform is Linux;
it allows breakpoints on functions which are invoked within SQL statements;
it never changes existing stored procedures or functions;
it is integrated with a general GUI client;
it allows commands like gdb and allows menu items / shortcut keys like ddd;
it is available on github as C++ source with GPL licence.
It’s alpha and it’s fragile but it works. Here is a demo.
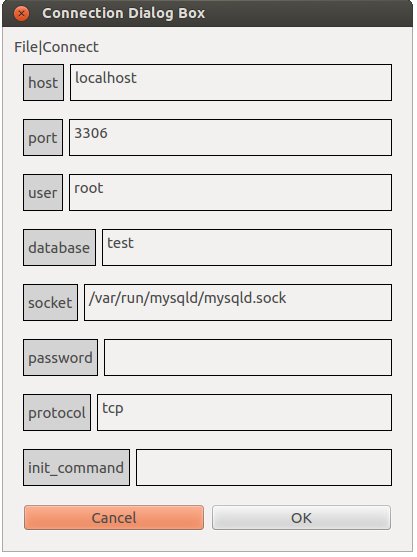
Start the client and connect to a running server, as root. Actually the required privileges are merely for creation of certain objects and SUPER, but I’m making this simple.
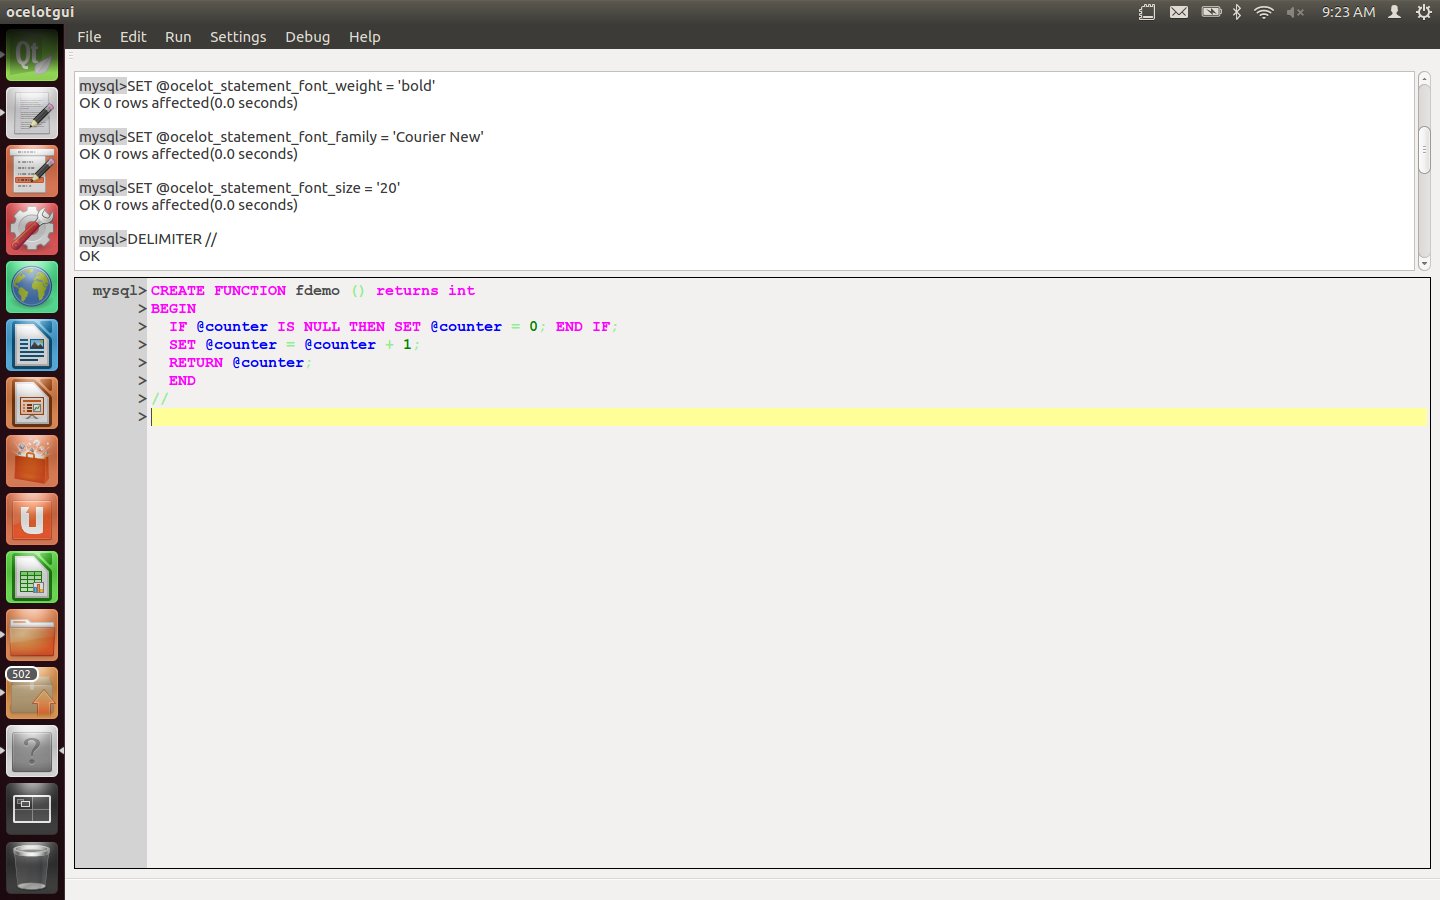
Type the statement: DELIMITER // (For all typed-in instructions, execute by typing carriage-return after the delimiter or by clicking Run|Execute.)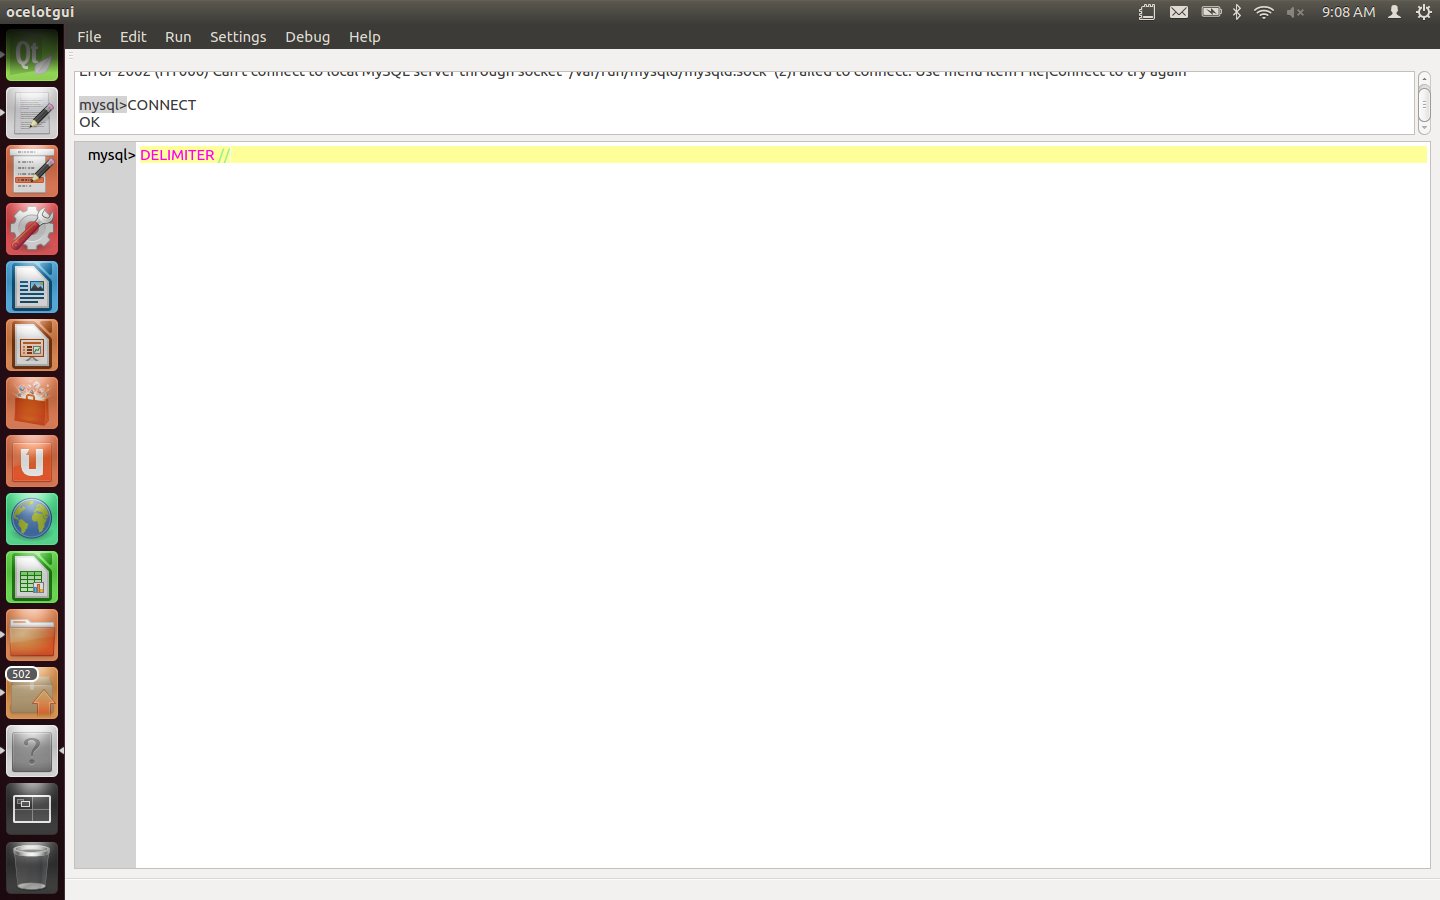
Create a function fdemo which updates and returns a counter.
CREATE FUNCTION fdemo () RETURNS INT
  BEGIN
    IF @counter IS NULL THEN SET @counter = 0; END IF;
    SET @counter = @counter + 1;
    RETURN @counter;
    END
  //
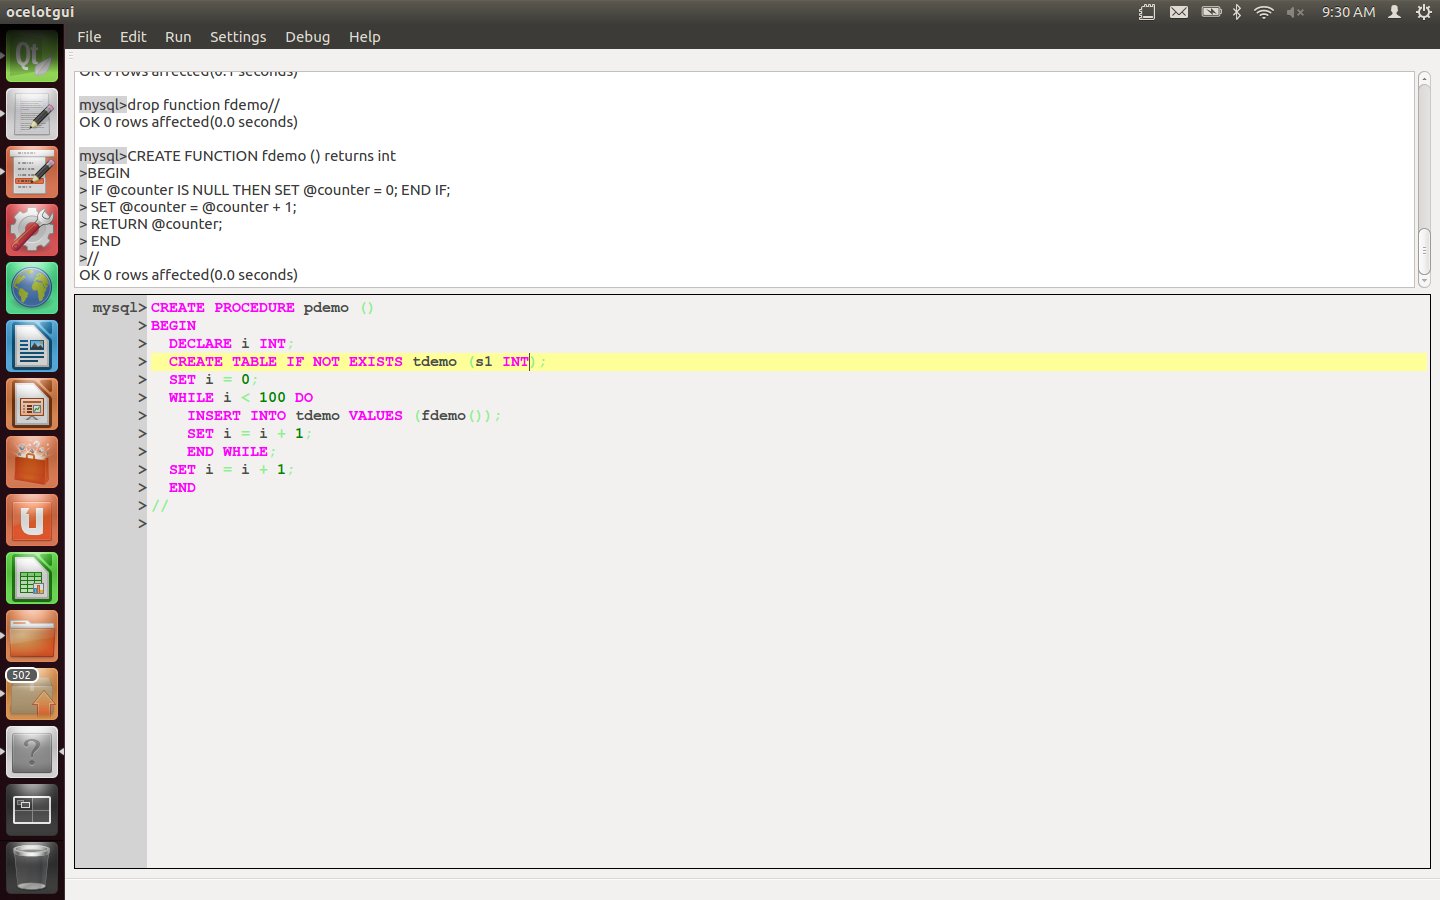
Create a procedure pdemo which contains a loop of “INSERT INTO tdemo VALUES (fdemo())” statements.
CREATE PROCEDURE pdemo ()
  BEGIN
    DECLARE i INT;
    CREATE TABLE IF NOT EXISTS tdemo (s1 INT);
    SET i = 0;
    WHILE i < 100 DO
      INSERT INTO tdemo VALUES (fdemo());
      SET i = i + 1;
      END WHILE;
    SET i = i + 1;
    END
  //
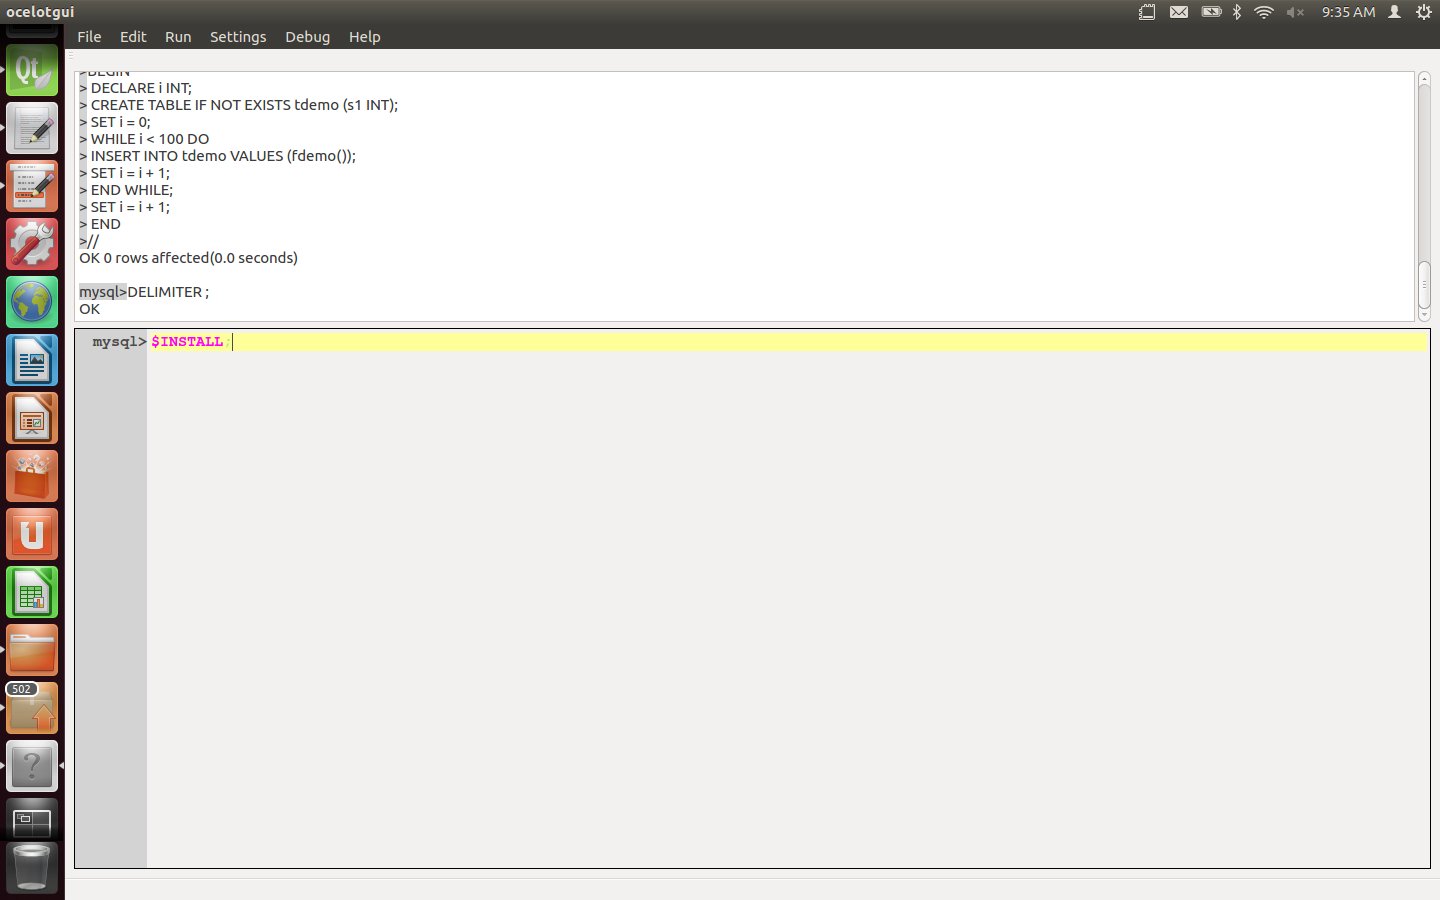
Type the statement: DELIMITER ;
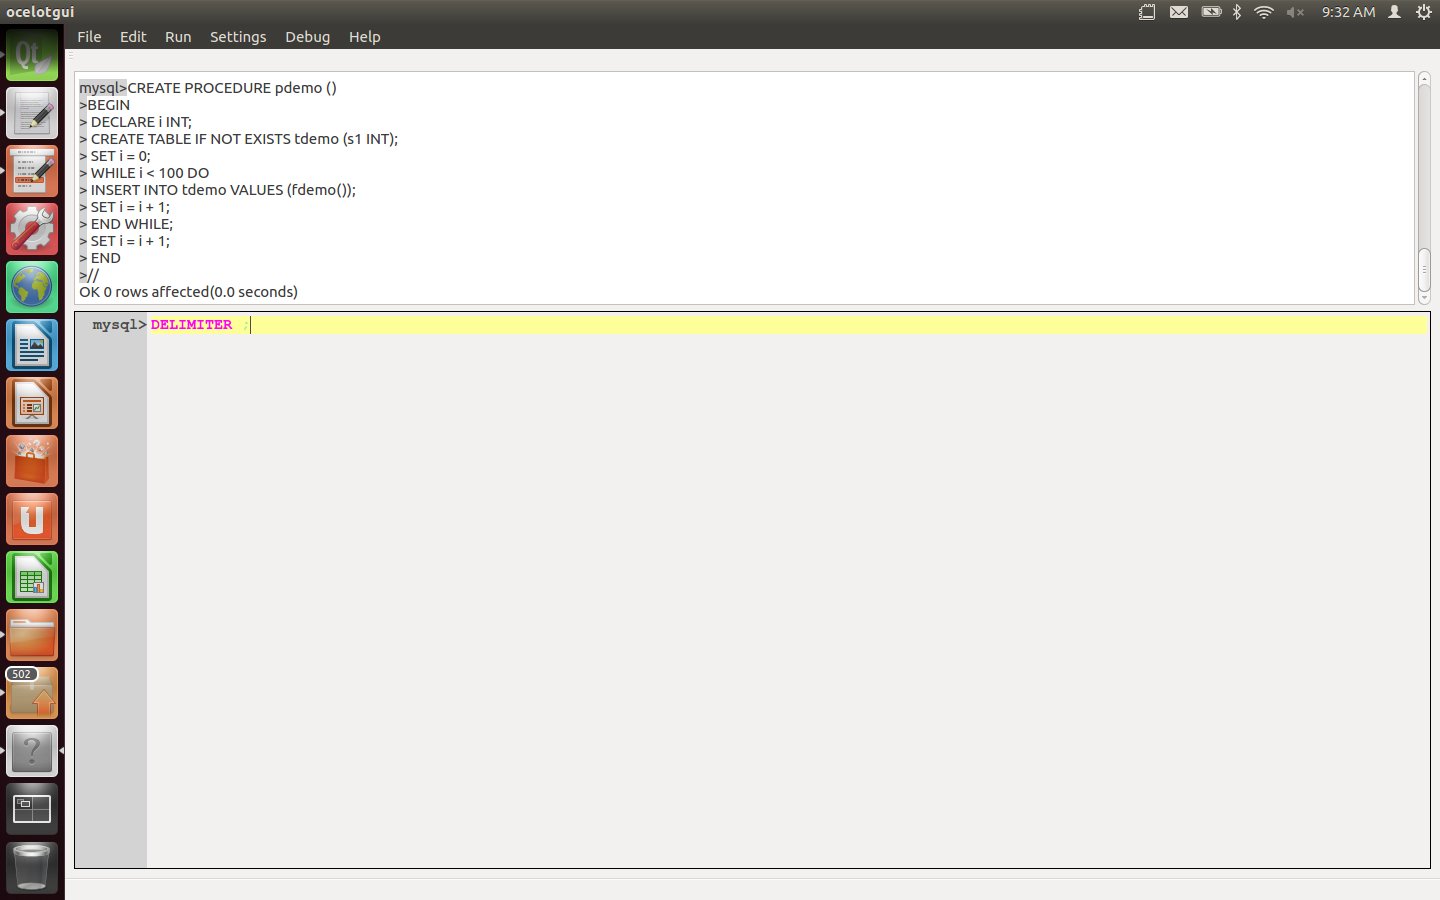
Type the statement: $setup fdemo, pdemo;
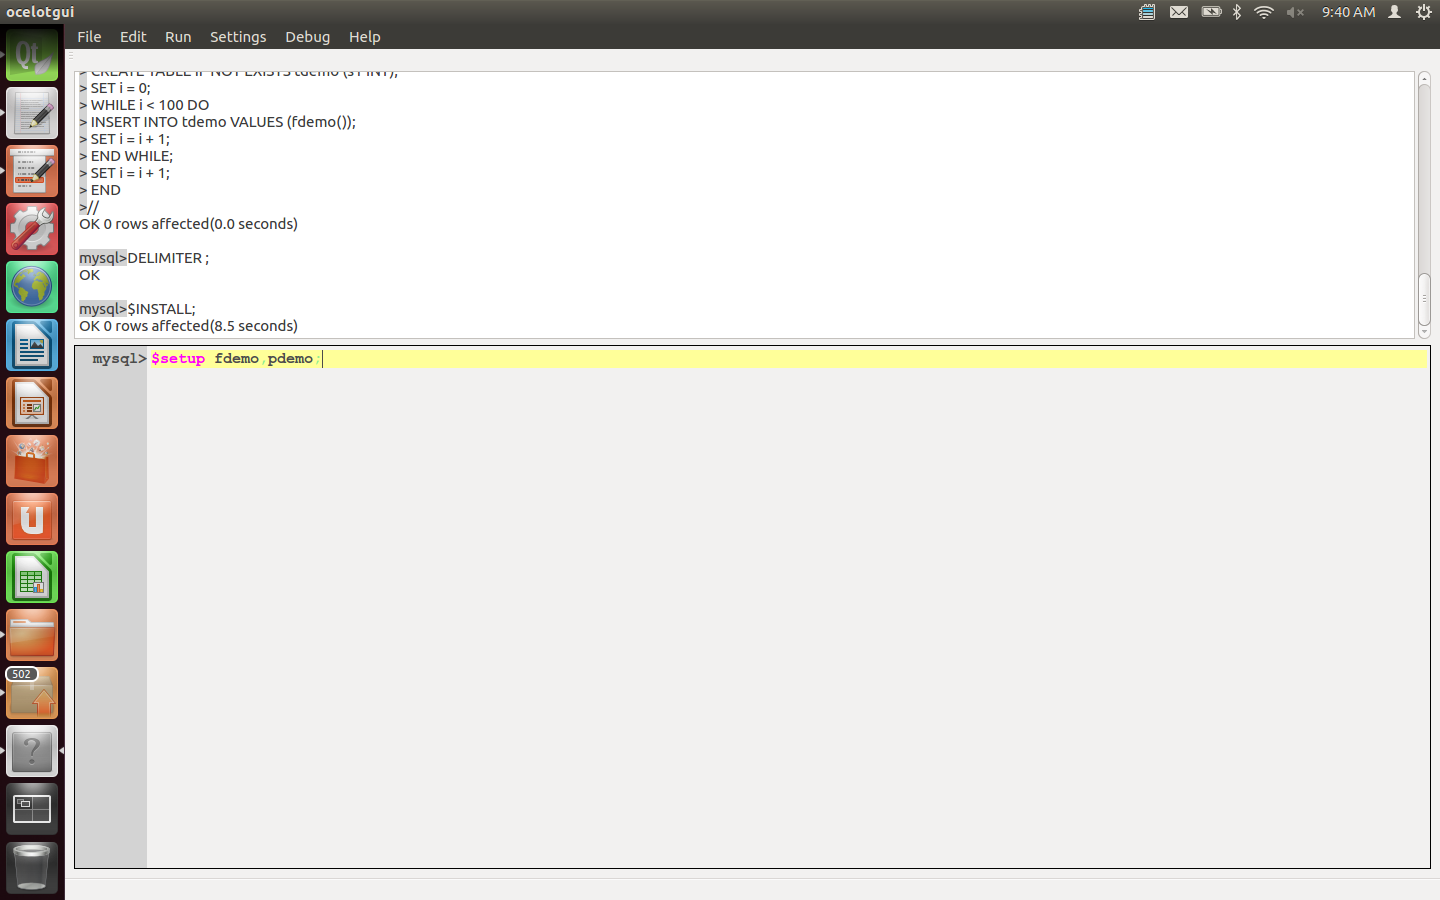
Type the statement: $debug pdemo;
After this statement is executed a tabbed widget appears. The first line of pdemo is highlighted. There is always a breakpoint before the first line.
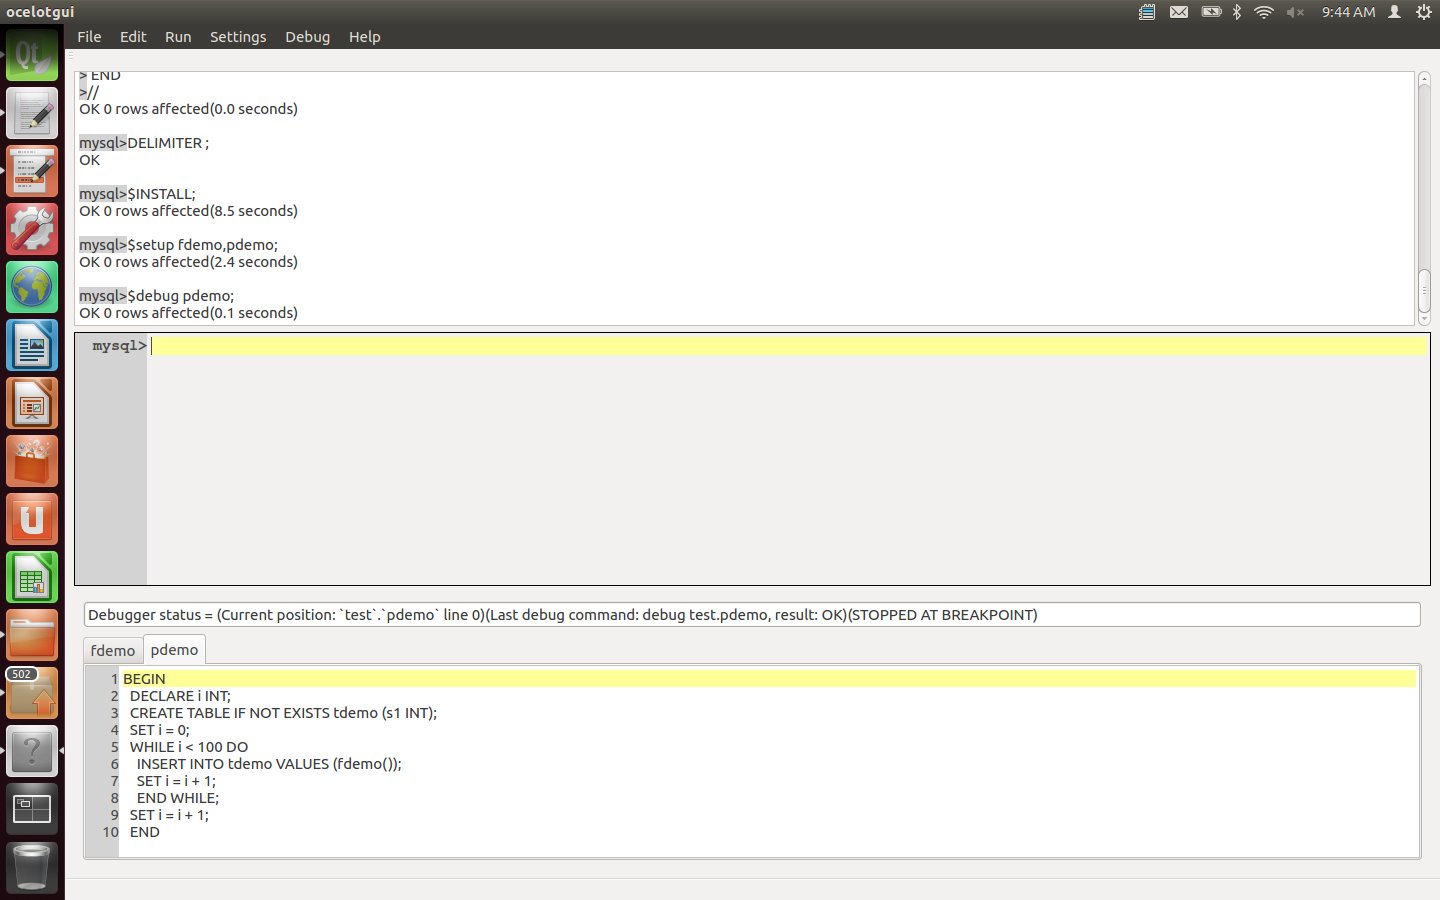
Click on the Debug menu to see what options are available. Debugger instructions may be done via the menu, via Alt keys, or via command-line statements. For example to enter a Next instruction one may now click Debug|Next, or type Alt+3, or type the statement: "$next;".
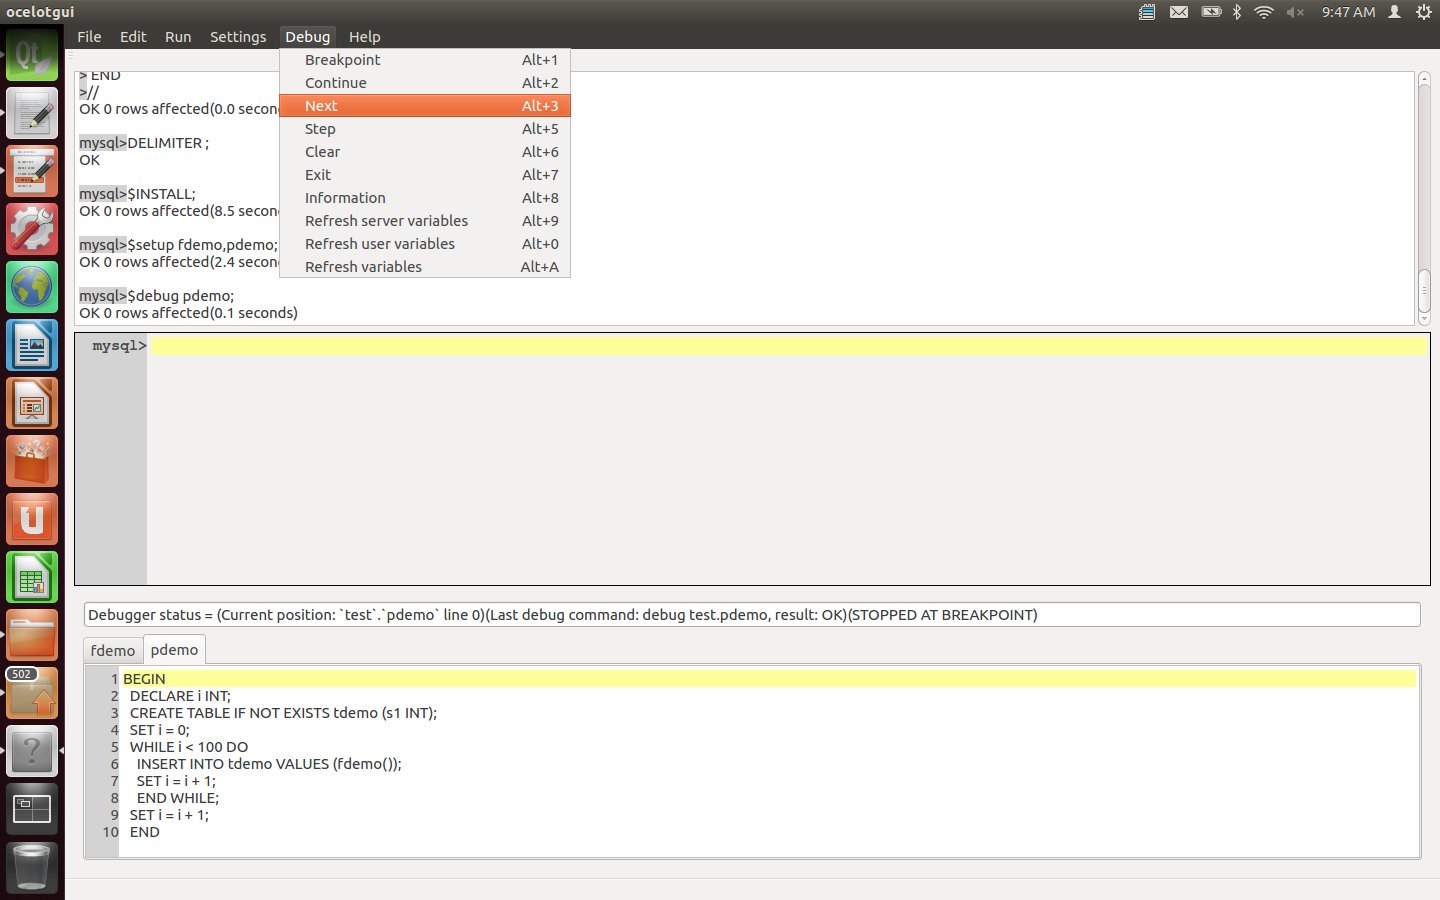
Enter a Next instruction repeatedly, watching how the highlighted line changes, until the INSERT line is highlighted.
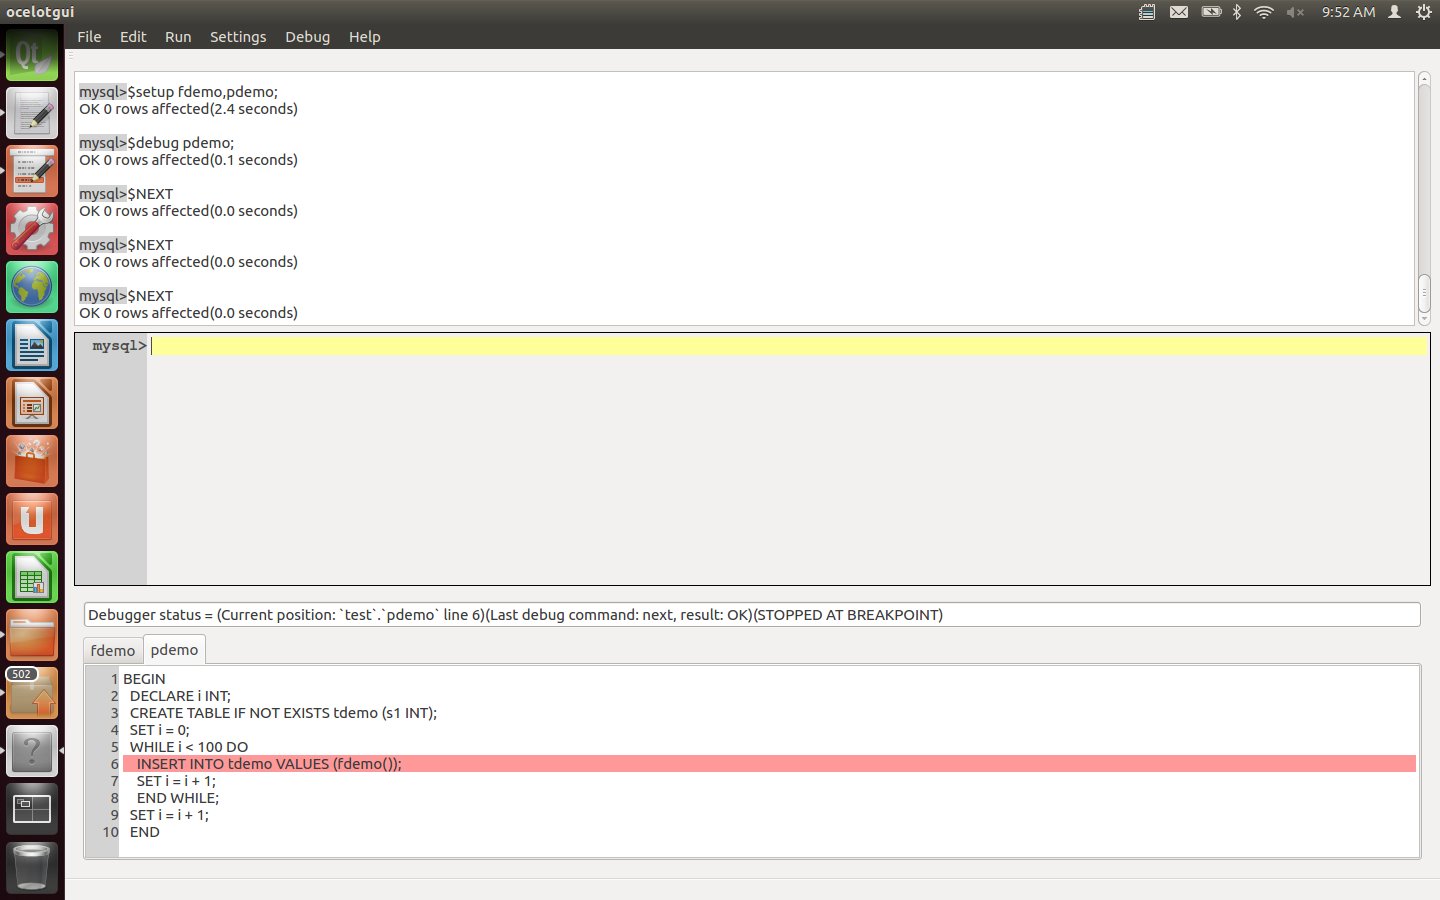
Enter a Step instruction. After this is executed, the function now comes into the foreground.
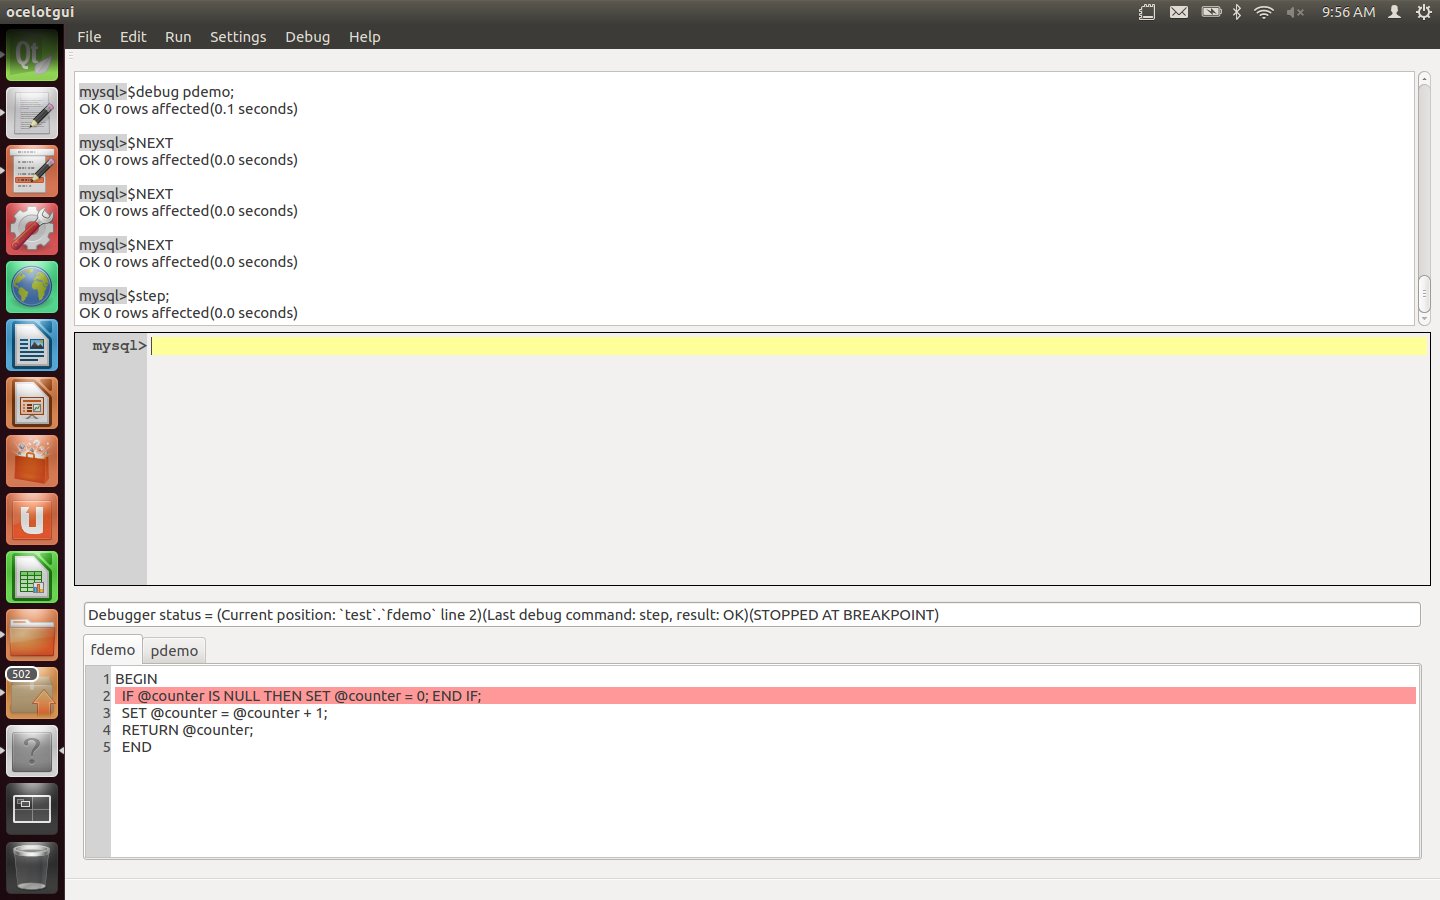
Enter three more Step (or Next) instructions. After these are executed, the procedure now is in the foreground again.
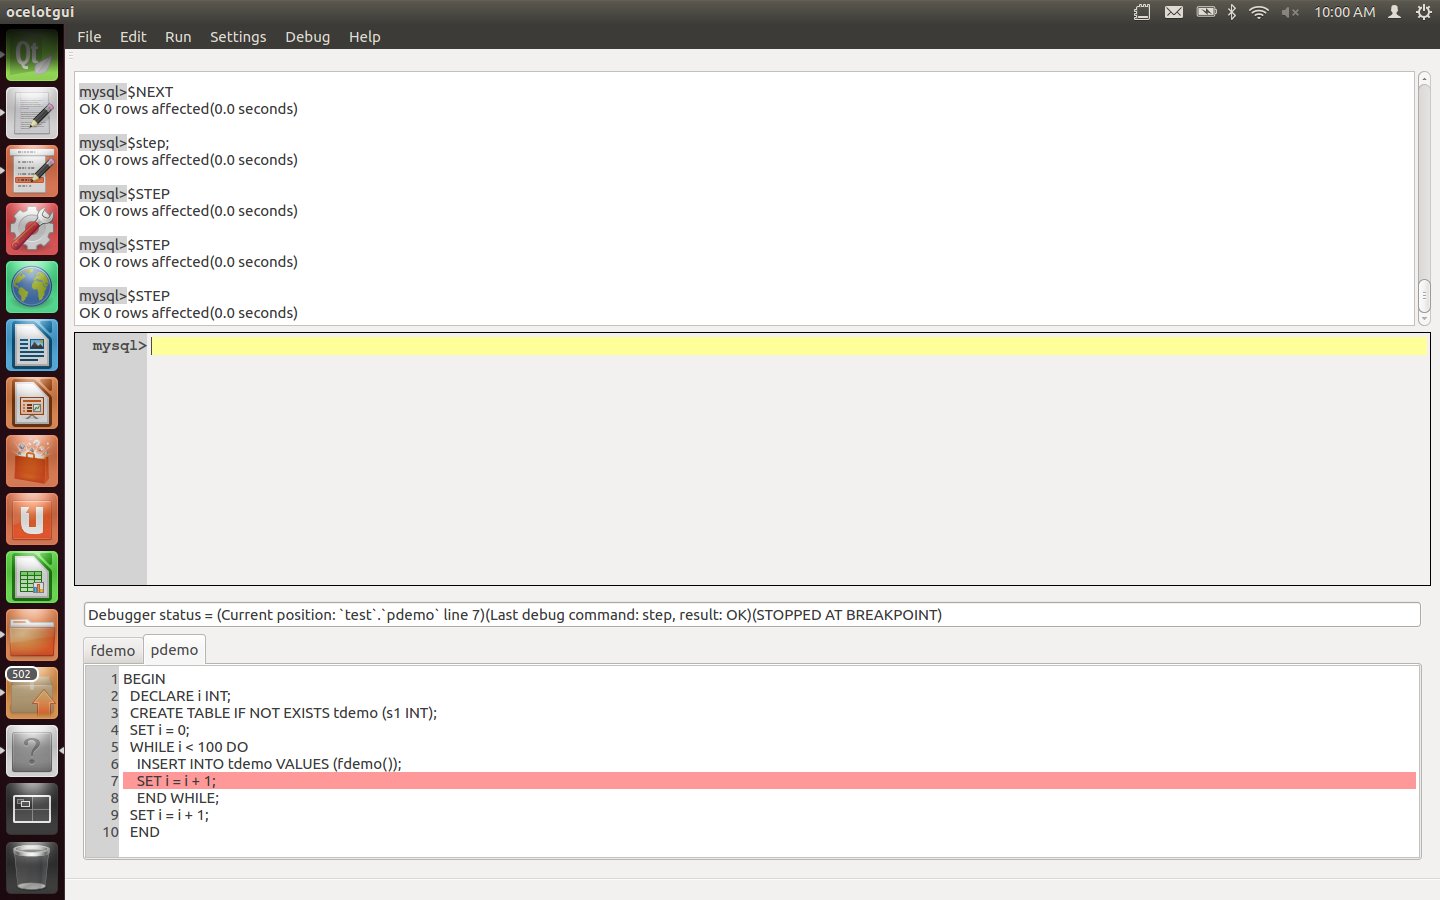
Set a breakpoint for the final executable line of the procedure. This can be done by clicking over the line number, or by moving the cursor to the line and then clicking Debug|Breakpoint, or by typing the statement "$breakpoint pdemo 9;". After this is executed, line 9 of pdemo has a small red mark showing that it has a breakpoint.
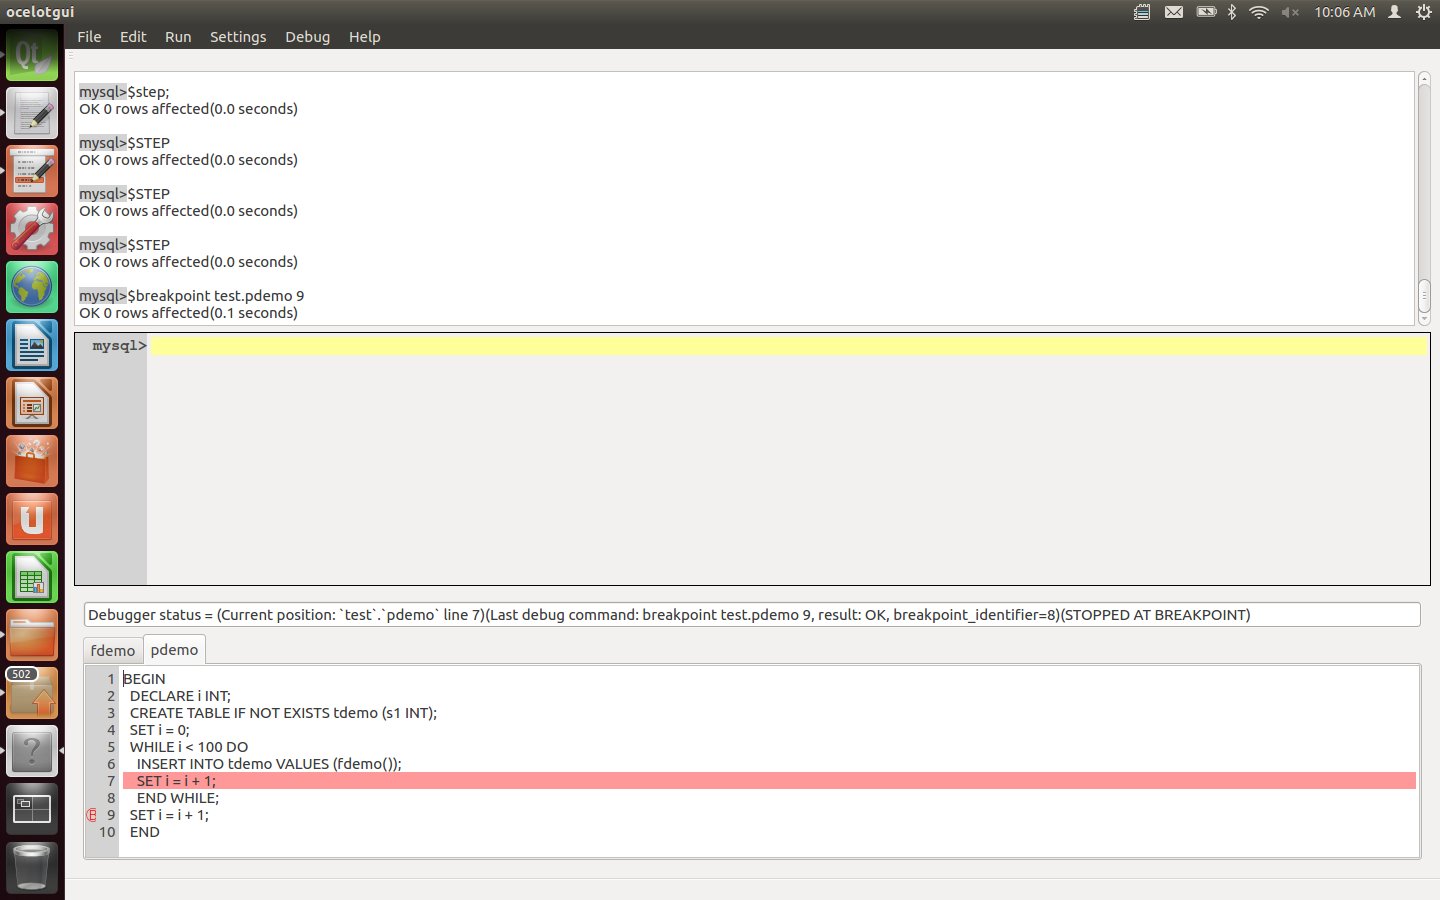
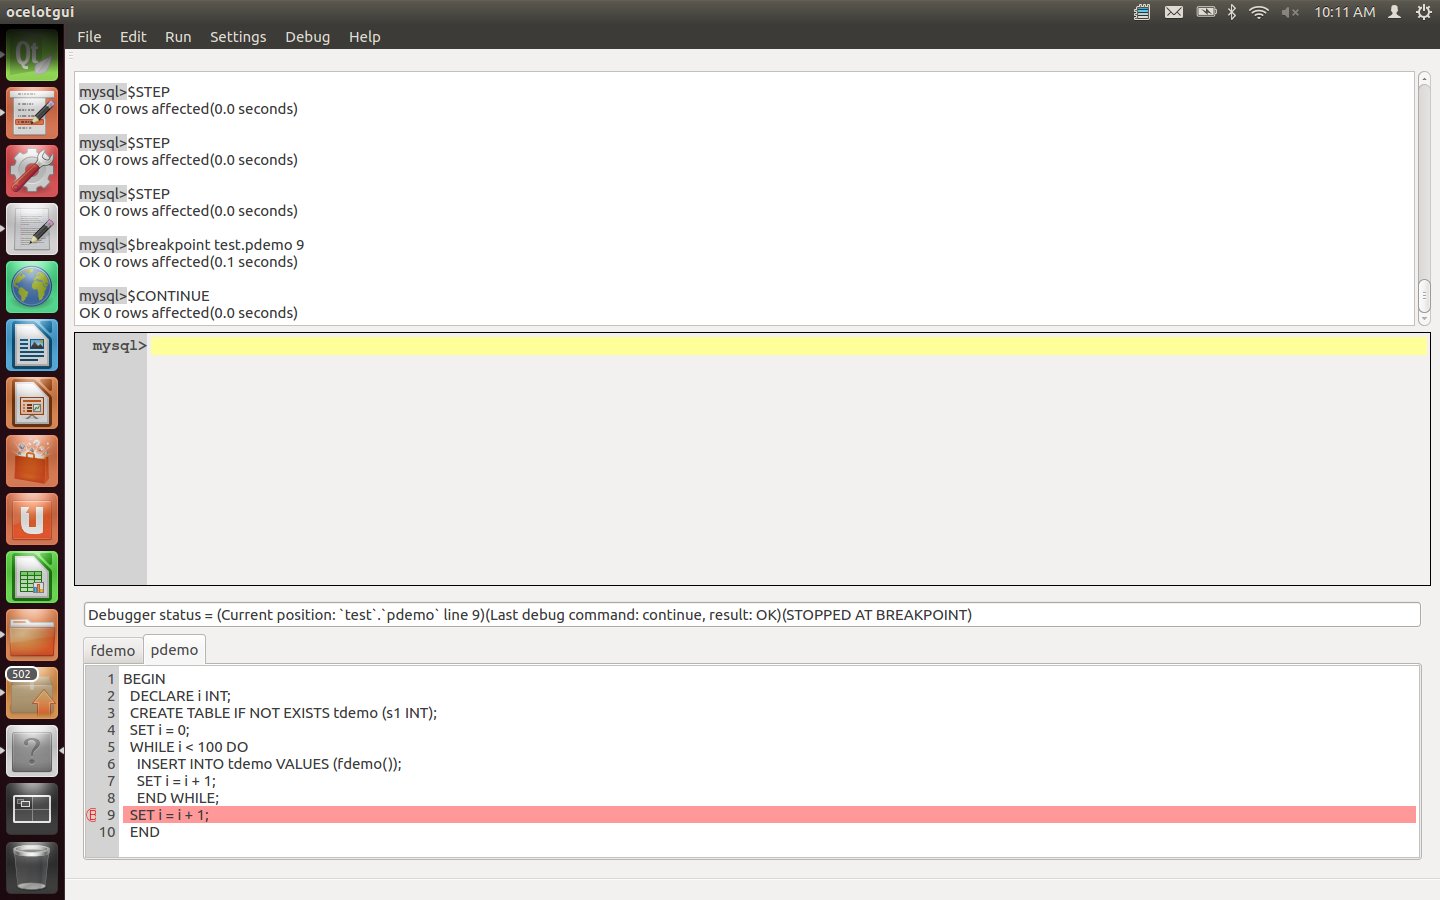
Enter a Continue instruction. After this is executed, watch the debugger highlight hop around 100 times as it moves through the loop, and finally settle on line 9.
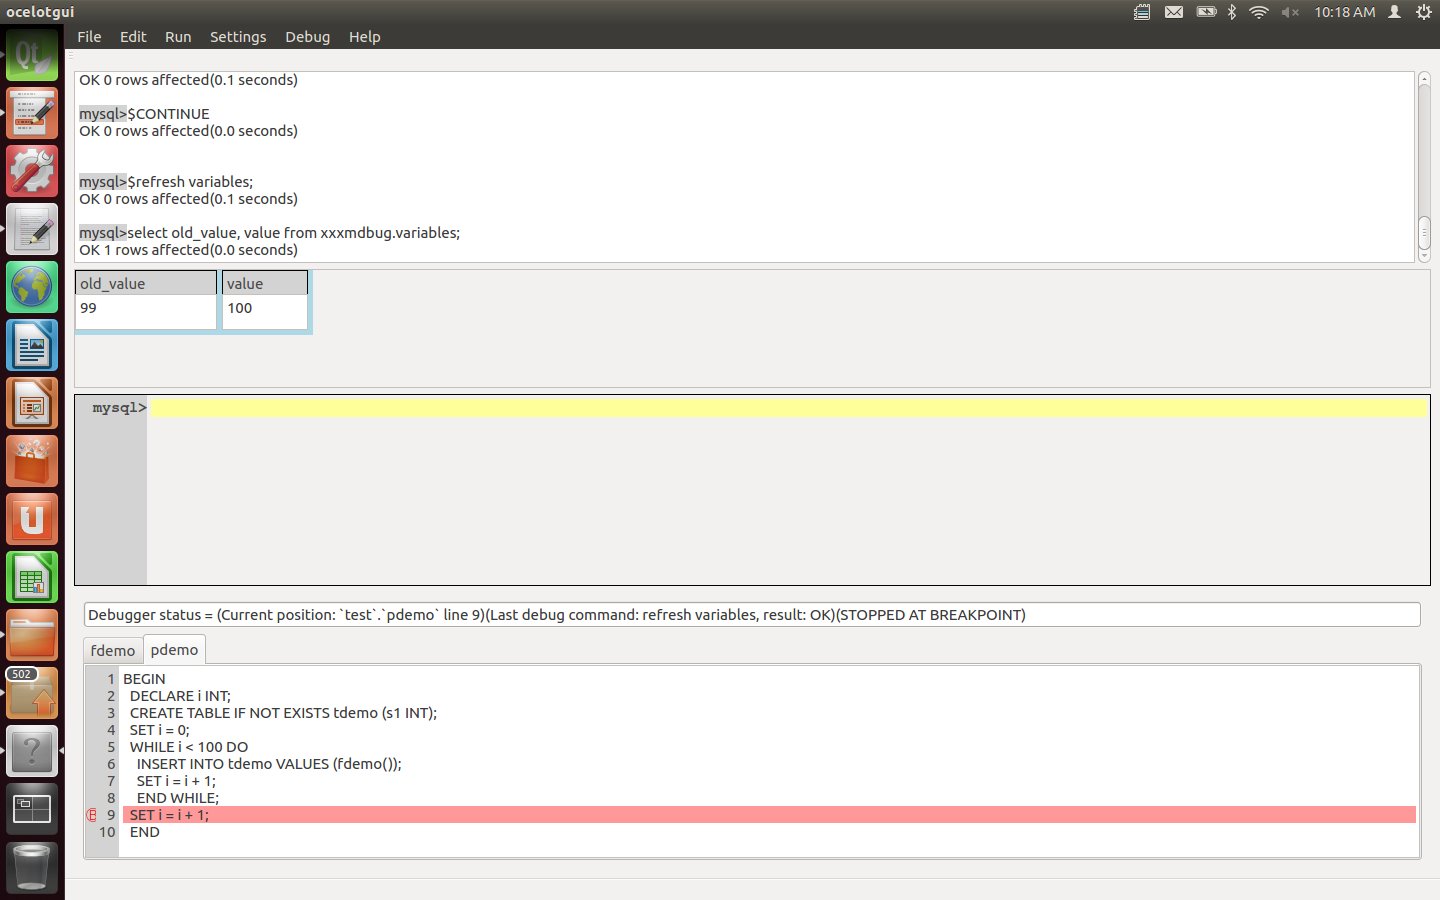
Type the statements "$refresh variables;" and "select old_value, value from xxxmdbug.variables;". After this is executed, the result-set widget will contain the old value of variable i (99) and the current value (100), This is the way that one examines DECLAREd variables (there are other statements for user variables and server variables).
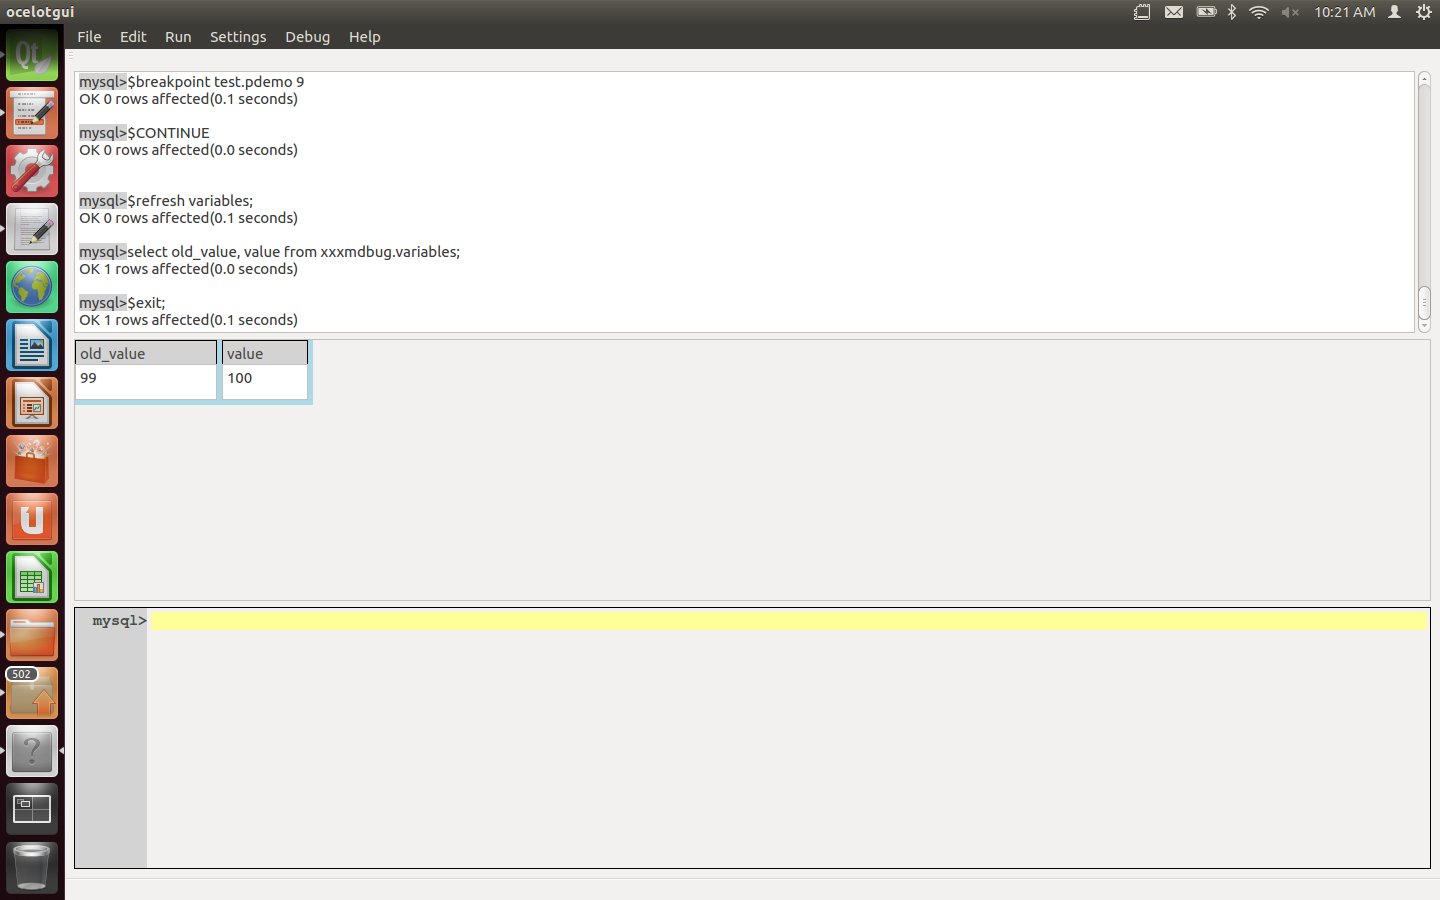
Enter an $exit instruction. This stops the debugging session, so the effects of the earlier $debug instruction are cancelled. The effects of the earlier $install and $setup instructions are not cancelled, so they will not have to be repeated for the next debugging session involving pdemo and fdemo.
Thus ends our demo. If you would like to confirm it: an introduction for how ocelotgui in general works is in the earlier blog post An open-source MySQL/MariaDB client on Linux" and the source + executable download files for version 0.3.0 are on github.com/ocelot-inc/ocelotgui.
If there is anything Ocelot can do to make your next debugging trip more enjoyable, please leave a comment. If you have private thoughts, please write to pgulutzan at ocelot.ca.
